 Alliance for Catholic Education
In the past few months, eLearning has become necessarily widespread because of the COVID-19 pandemic. Families have quickly implemented at-home structures to teach their children. Unfortunately, the extensive use of eLearning raises issues of equity. Two months after school closings, the New York Times wrote about the stark contrast between the eLearning experiences at a high-income school and a low-income school. This article highlights the differing experiences between two families who attend schools serving students from different income backgrounds. Similarly concerned with disparities during eLearning, EdSurge published an article discussing recent data from the software program, i-Ready. The latest data shows a set of troubling statistics that indicate usage data for the program is related to income levels — lower-income students are using the program at lower rates. Still, when they are using the program, they are using the program for longer periods than those in other income levels.
i-Ready is a software program developed by Curriculum Associates, an educational software and curriculum company. i-Ready delivers student instruction, performance diagnostics, and progress reports to teachers in both English language arts and mathematics. Students receive differentiated online instruction according to their ability and continuously receive feedback at their just-right level. The software program is customized for each student and incorporates interactive lessons, games, example problems, and practice problems. i-Ready serves nearly a fourth of all students in kindergarten through eighth grade.
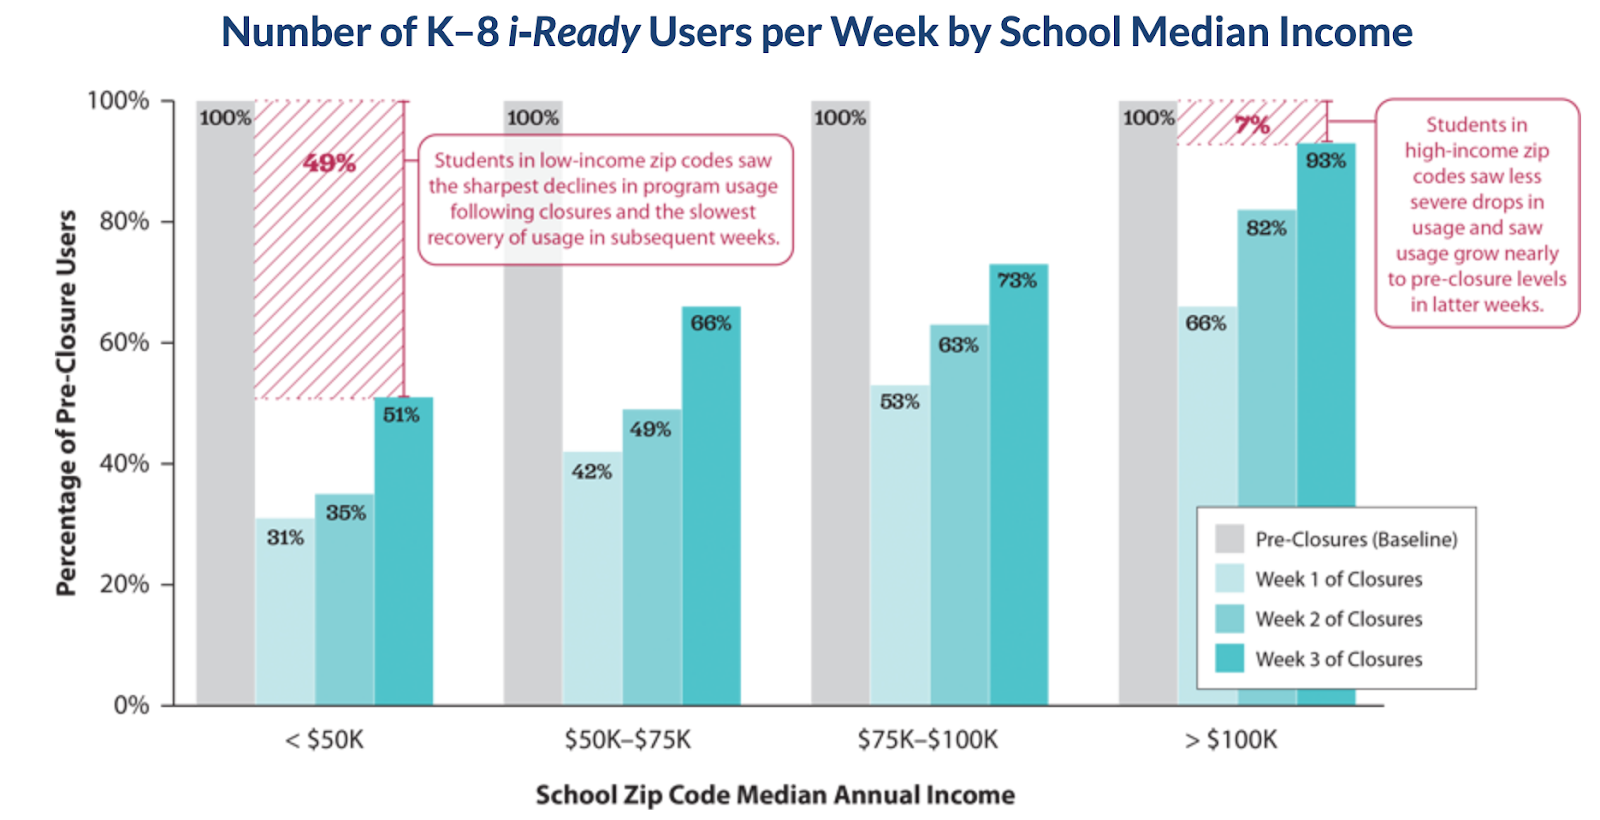
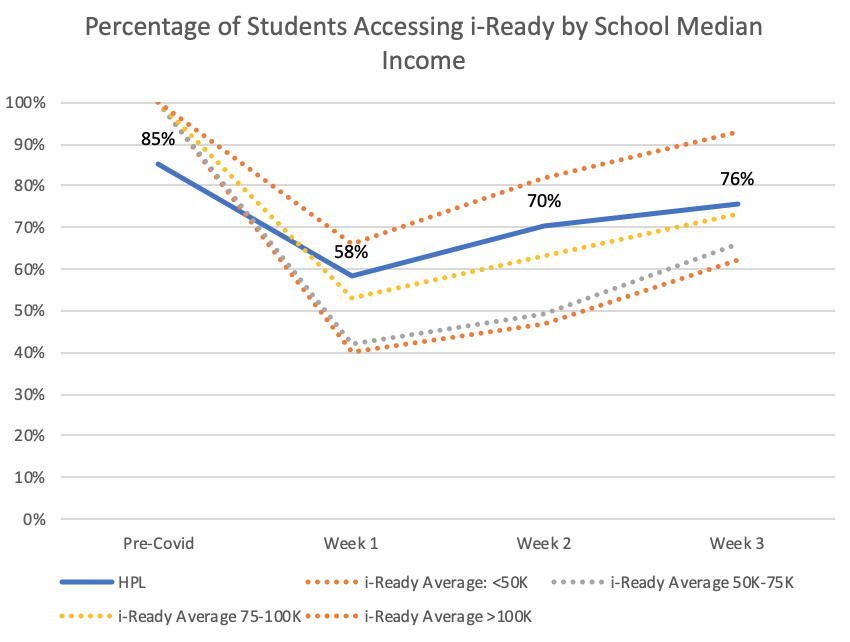
After a few months of eLearning, Curriculum Associates released a small set of data to highlight issues of inequity in education and, more importantly, during eLearning. Curriculum Associates analyzed its data in a few ways. First, they looked at the percentage of usage, which measures how many students were accessing i-Ready in a given week. Then they looked at minutes on task. Finally, they compared these two data points with the median annual income of the school's zip code. Curriculum Associates considered schools located within zip codes with median incomes of over $100,000 as serving higher-income students. Schools located in areas where the median income was between $50,000-$100,000 Curriculum Associated considered middle-income, and considered schools within zip codes where the median income was below $50,000 low-income. After the pandemic hit, student usage fell off drastically during week one of school closures. By weeks two and three, students from middle-income and high-income zip codes appear to regain some, if not most, of their overall usage. However, students in low-income zip codes did not make the same recovery with their usage. By week three of school closures, barely 50 percent of students from low-income zip codes were using i-Ready.
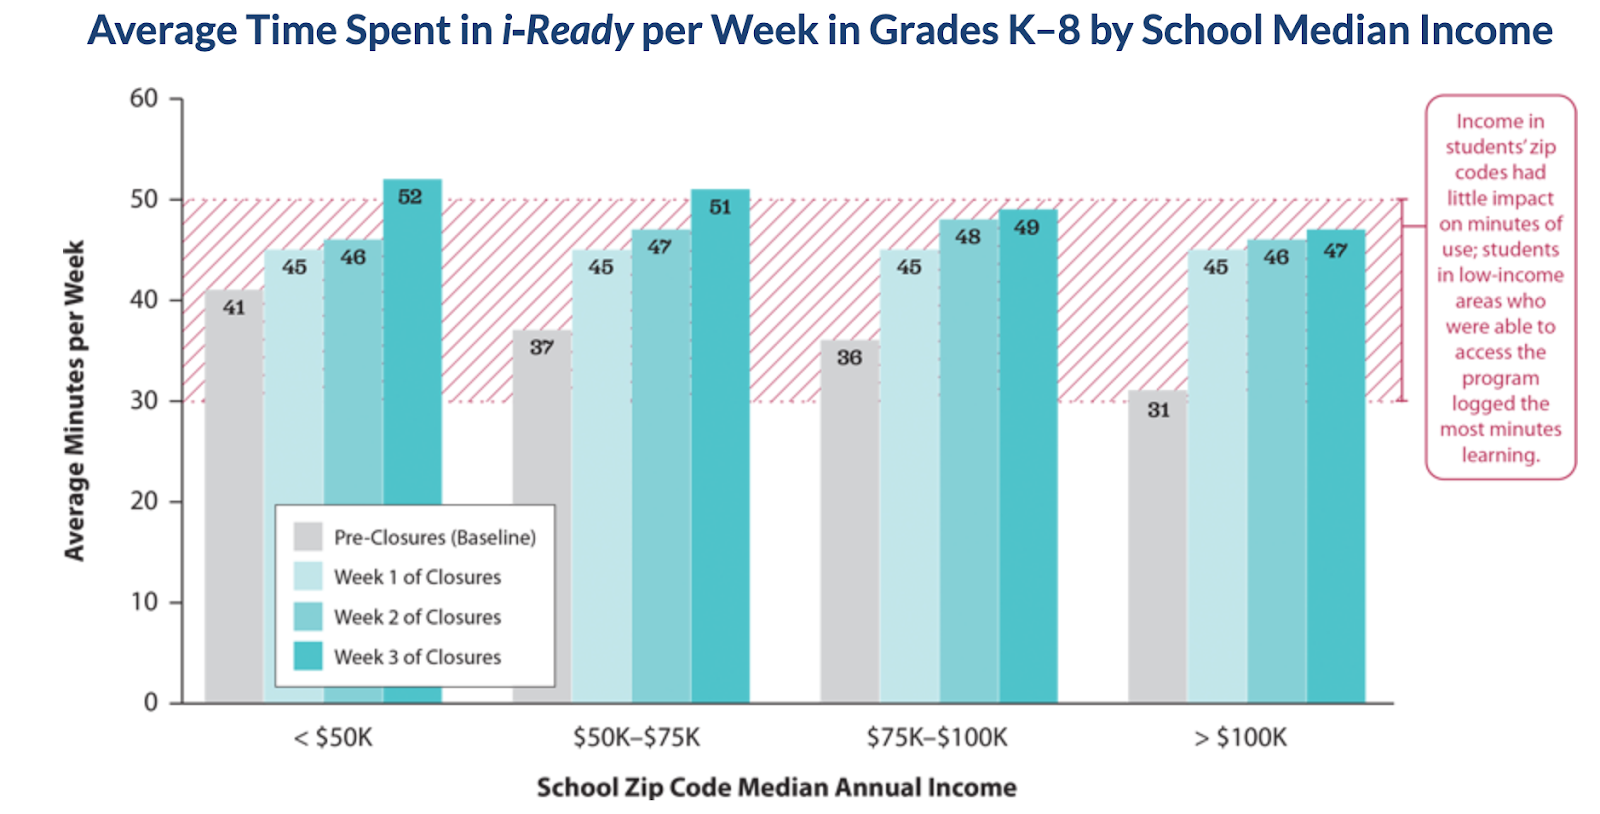
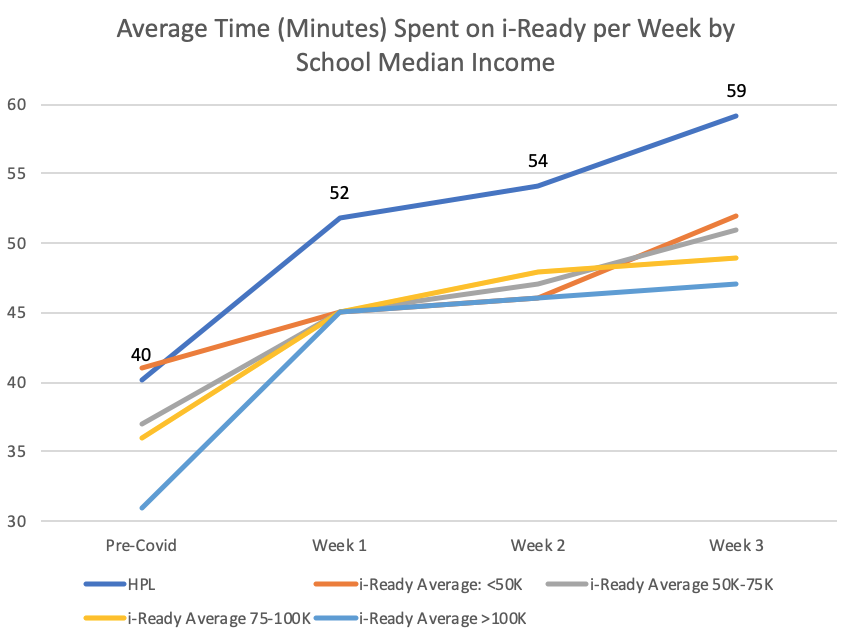
The next set of data from Curriculum Associates presents the average amount of time students spent using i-Ready software. Before the pandemic, students from low-income zip codes spent more time on i-Ready than students from higher-income zip codes. During week one of closures, all students spent the same amount of time on i-Ready. By week three, students from low-income zip codes regain a slight edge over their higher-income counterparts. However, the difference between students from the highest-income zip codes and lowest-income zip codes was not as significant as the difference between the two groups before COVID-19 related school closures.
The Higher-Powered Learning team was particularly interested in the i-Ready data. The HPL team partners with five schools in the St. Paul-Minneapolis area. Three of the five schools use i-Ready as one of their primary software programs in both reading and math for groups of students. More than 400 students use i-Ready in HPL partner schools. Two of these partner schools are in zip codes where the median income is less than $50,000, and the other is in a zip code with a median income of $57,000. Considering the population of students at this third school, where over a quarter receive free or reduced lunch, the HPL team felt it appropriate to include this school in the low-income zip code category.
When the HPL team compared their students to Curriculum Associates' data, encouraging patterns emerged. The HPL team began by examining the percentage of i-Ready users by school median income after school closures. This measure demonstrates whether students had access to i-Ready while they were at home. During week one, 58 percent of students who regularly use i-Ready accessed the program. By week two, 70 percent of HPL i-Ready students were accessing the program. And by week three, 75 percent of HPL i-Ready students were accessing the program. As a result, students from HPL spent more time on i-Ready than students in every income bracket except those from zip codes where the median income was above $100,000.
The next set of data that the HPL Team considered was the average weekly time spent on instructional material in i-Ready. Once again, the numbers are encouraging. After COVID-19 related school closures, HPL students who use i-Ready spent more time on the program than any other group. Initially, the difference in usage does not seem significant. During the first week, HPL students spent seven extra minutes on i-Ready than all groups. During the second week of closures, HPL students spent 6-8 additional minutes of instructional time on i-Ready than their peers in all zip codes. Finally, during the last week of instruction, HPL students spent between 7-12 minutes of additional instructional time on i-Ready. If the extra time HPL students spent on i-Ready during COVID-19-related closures is multiplied by eleven weeks of eLearning, HPL students receive 1-2 weeks of additional instruction compared with their peers.
This data is incredibly encouraging to the HPL team because it suggests that their work may be addressing educational inequities. When the HPL team compared their data with the i-Ready data, students from lower-income backgrounds who receive HPL interventions are accessing i-Ready instruction more often than their non-HPL peers. The team is also encouraged to see that HPL students are spending more time than their peers utilizing instruction on the program. These data points suggest that HPL interventions are increasing the academic learning time of students with lower-income backgrounds. Dr. David Berliner defines academic learning time as "part of allocated time in a subject-matter area... in which a student is engaged successfully in the activities or with the materials to which he or she is exposed, and in which those activities and materials are related to educational outcomes that are valued." When using i-Ready, students are engaged with math or literacy topics, at their ability, and these outcomes are valuable for the students' academic trajectory — so time using i-Ready is academic learning time. This is relevant because research shows that increased student achievement is highly correlated with increased academic learning time. Since HPL interventions increase academic learning time amongst students of lower-income backgrounds, and increased academic learning time is correlated with increased student achievement, the data suggests that HPL interventions are addressing educational inequities. HPL's interventions appear to close usage gaps and instructional-time gaps between students from lower-income backgrounds and their higher-income peers.
The HPL team is optimistic that closing these gaps in academic learning time will ultimately help close achievement gaps between HPL students and their peers. However, we do not yet have data comparing these student groups on testing. So, while encouraging, this data set is still preliminary, it must be supplemented with others, and the HPL team still has more analysis to do. The HPL team will continue to explore the implications of this data and continue conversations around technology access and equity. Over the next few months, as the country recovers from the impacts of COVID-19, educators and researchers will need to explore ways to ensure that all students have more equitable access to technology and meaningful eLearning experiences.